

Table of contents
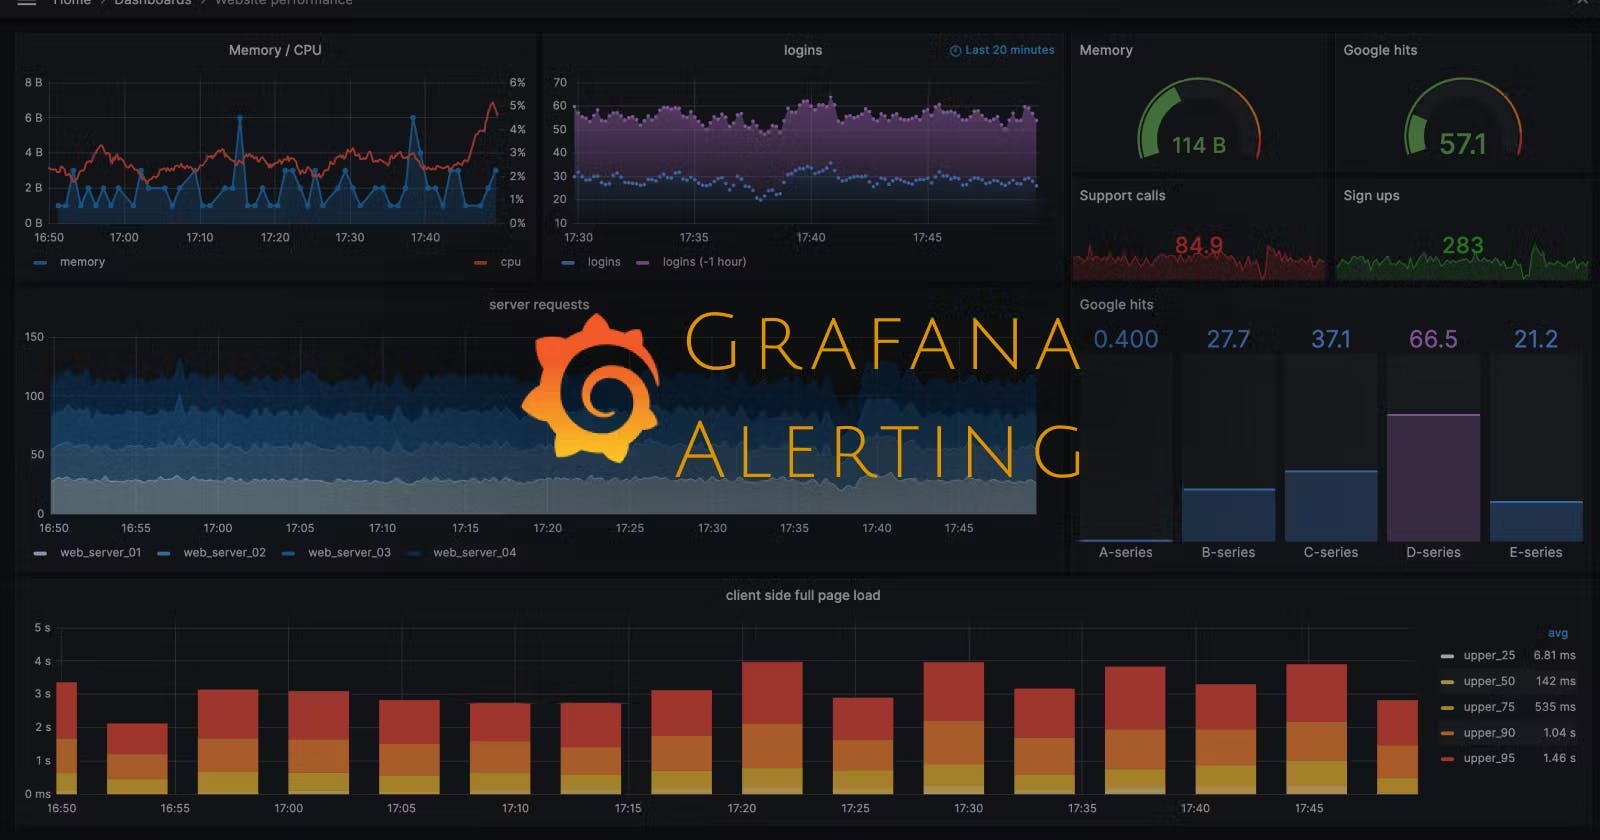
What is Grafana Cloud?
Grafana Cloud serves as a monitoring platform designed to assist DevOps teams in overseeing their systems and applications. This platform offers a centralized hub for gathering and visualizing data from diverse sources, including servers, databases, and applications.
Task: Setting Up Alerts in Grafana
Grafana Alerting enables you to quickly identify and address issues within your systems as soon as they arise. Efficiently manage and respond to alerts in a consolidated view, enhancing your team's ability to swiftly pinpoint and resolve problems.
Before proceeding make sure to set up Grafana and the data source in your system.
You can refer to the blog here: Blog
Verify Loki Data Source Configuration
Before creating alerts, ensure that the Loki data source is added and configured correctly. Navigate to the "Settings" or "Data Sources" section in Grafana and confirm that Loki is configured to provide metrics.
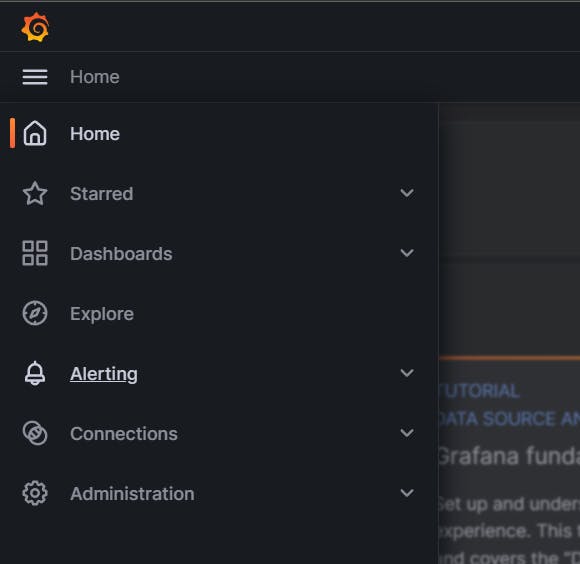
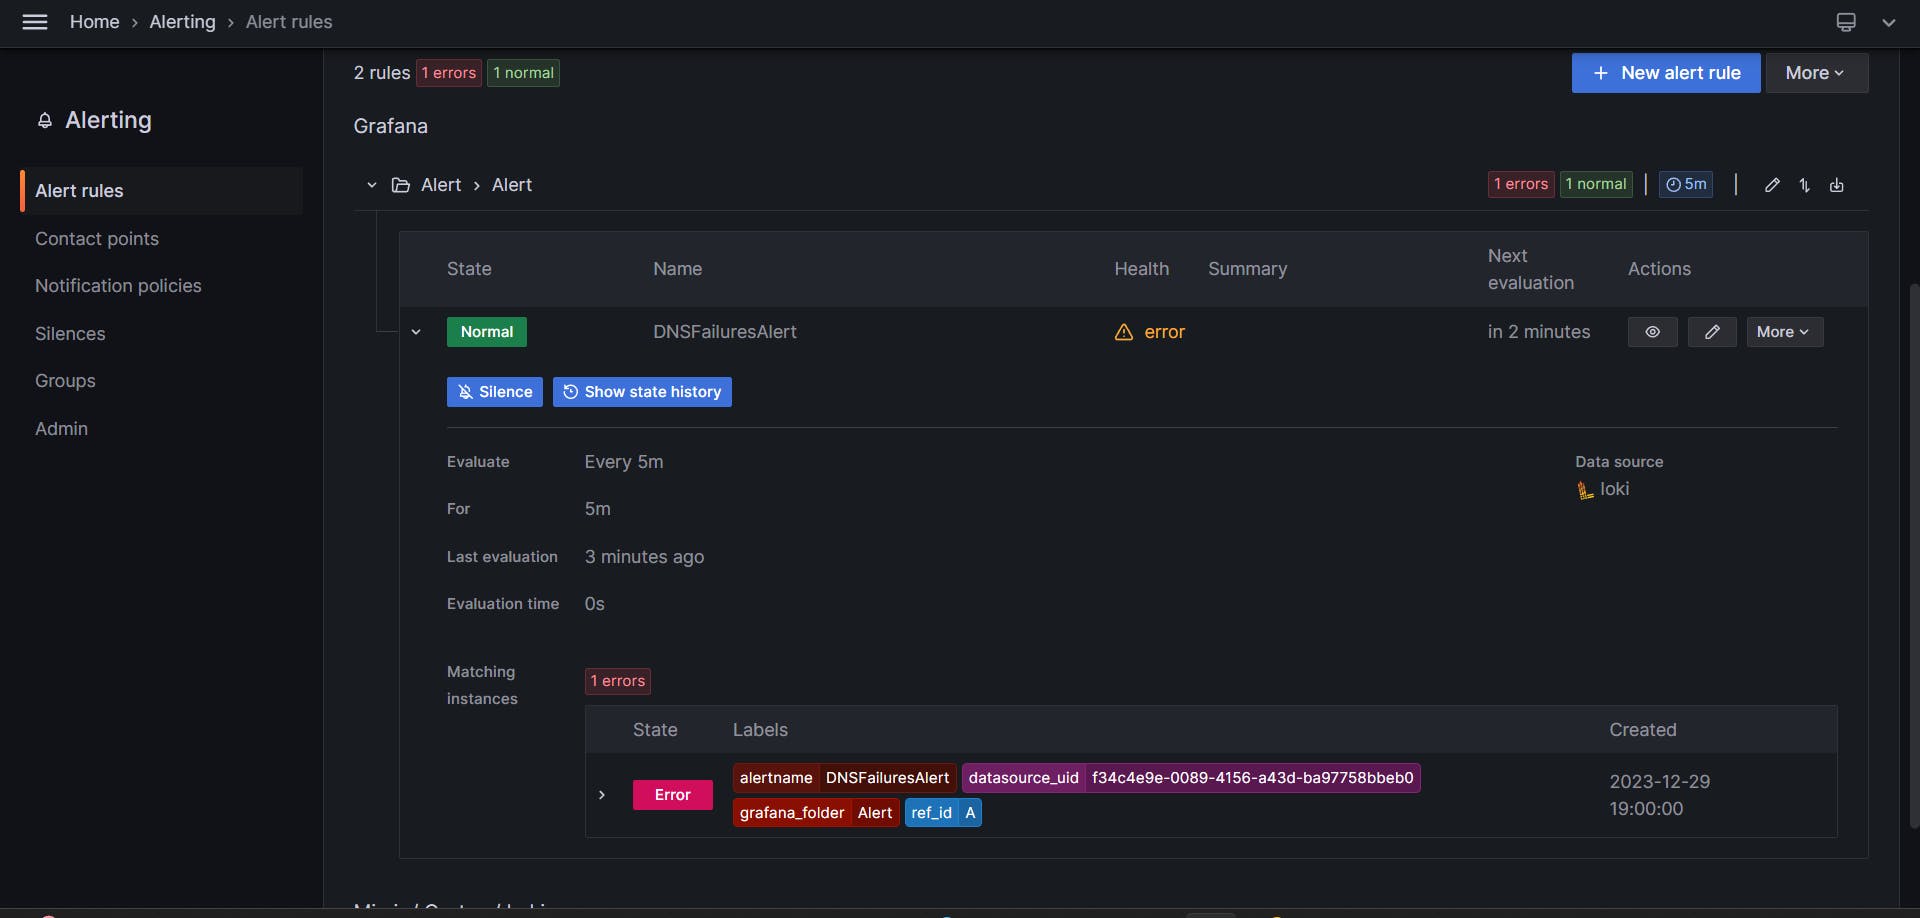
Access the Alerting Section
On the left-hand side menu, locate and click on the "Alerting" section. This is where you can manage and create new alerts.
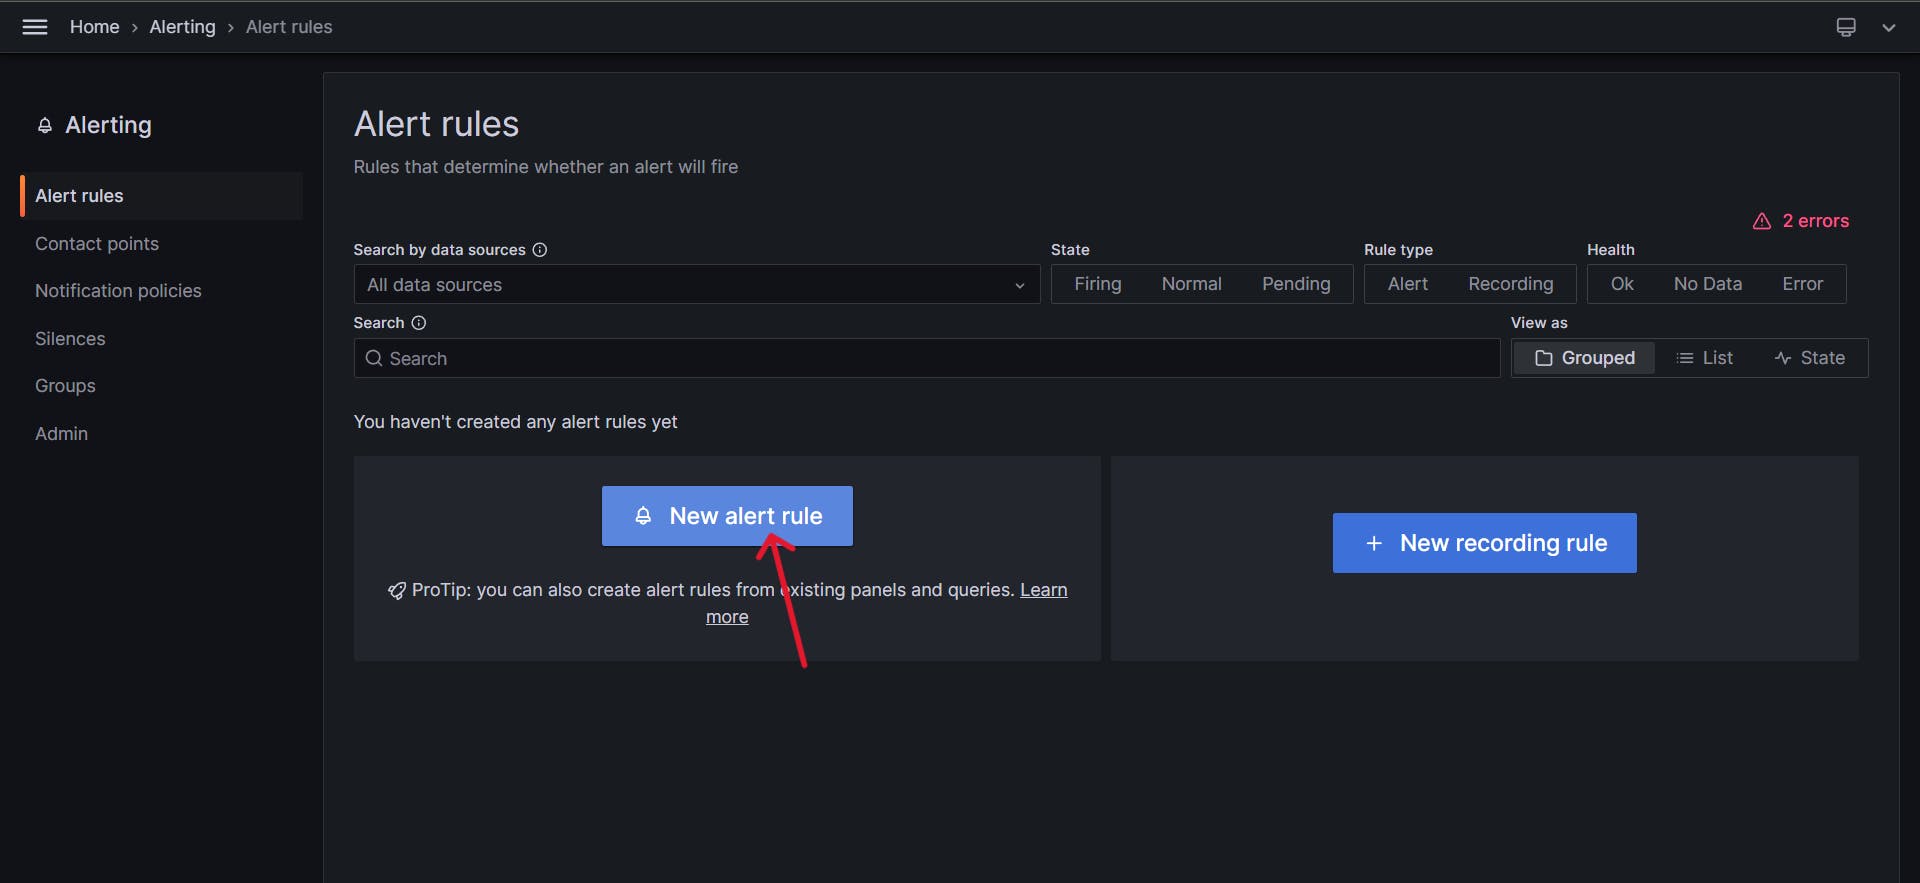
Click on "Create Alert"
Within the Alerting section, click on the "Create Alert" button to initiate the process of setting up a new alert rule.
Define Alert Conditions
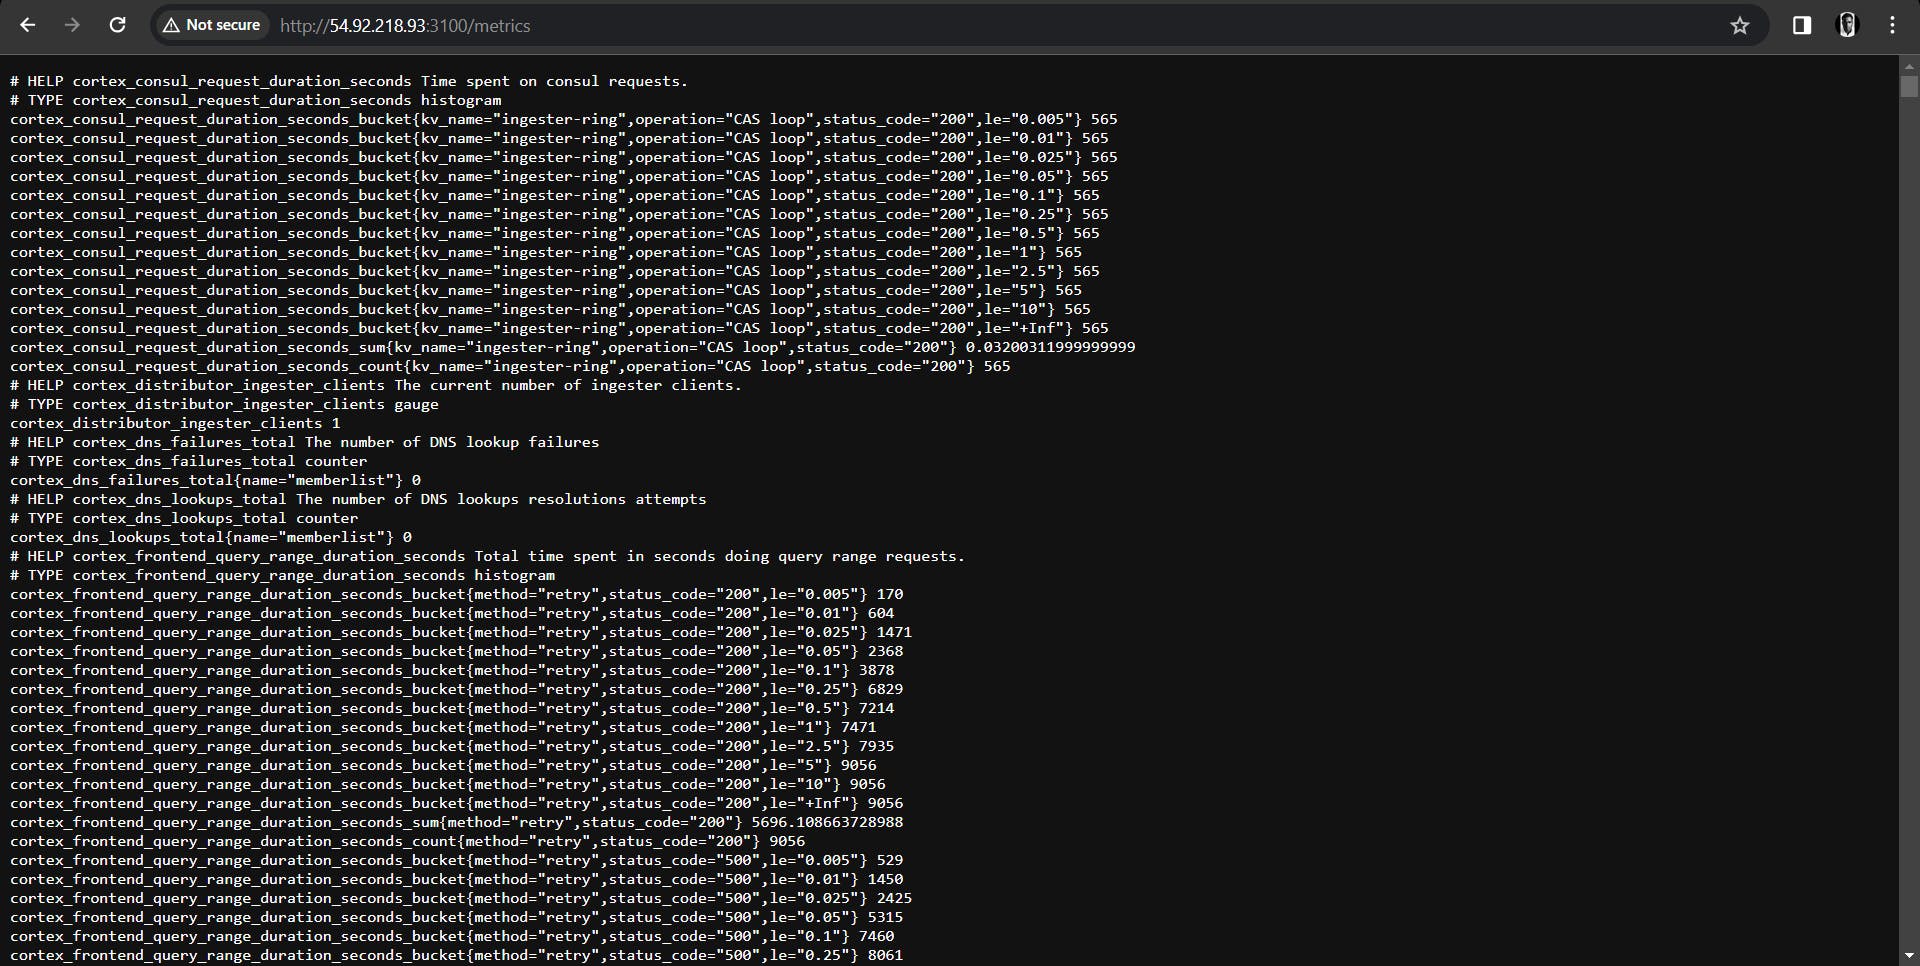
In the alert creation form, give your alert a descriptive name, such as "DNS Failures Alert." Now, it's time to define the conditions that trigger the alert. In our example, we used a query to monitor DNS failures:
sum(rate(cortex_dns_failures_total{name="memberlist"}[5m])) by (name)
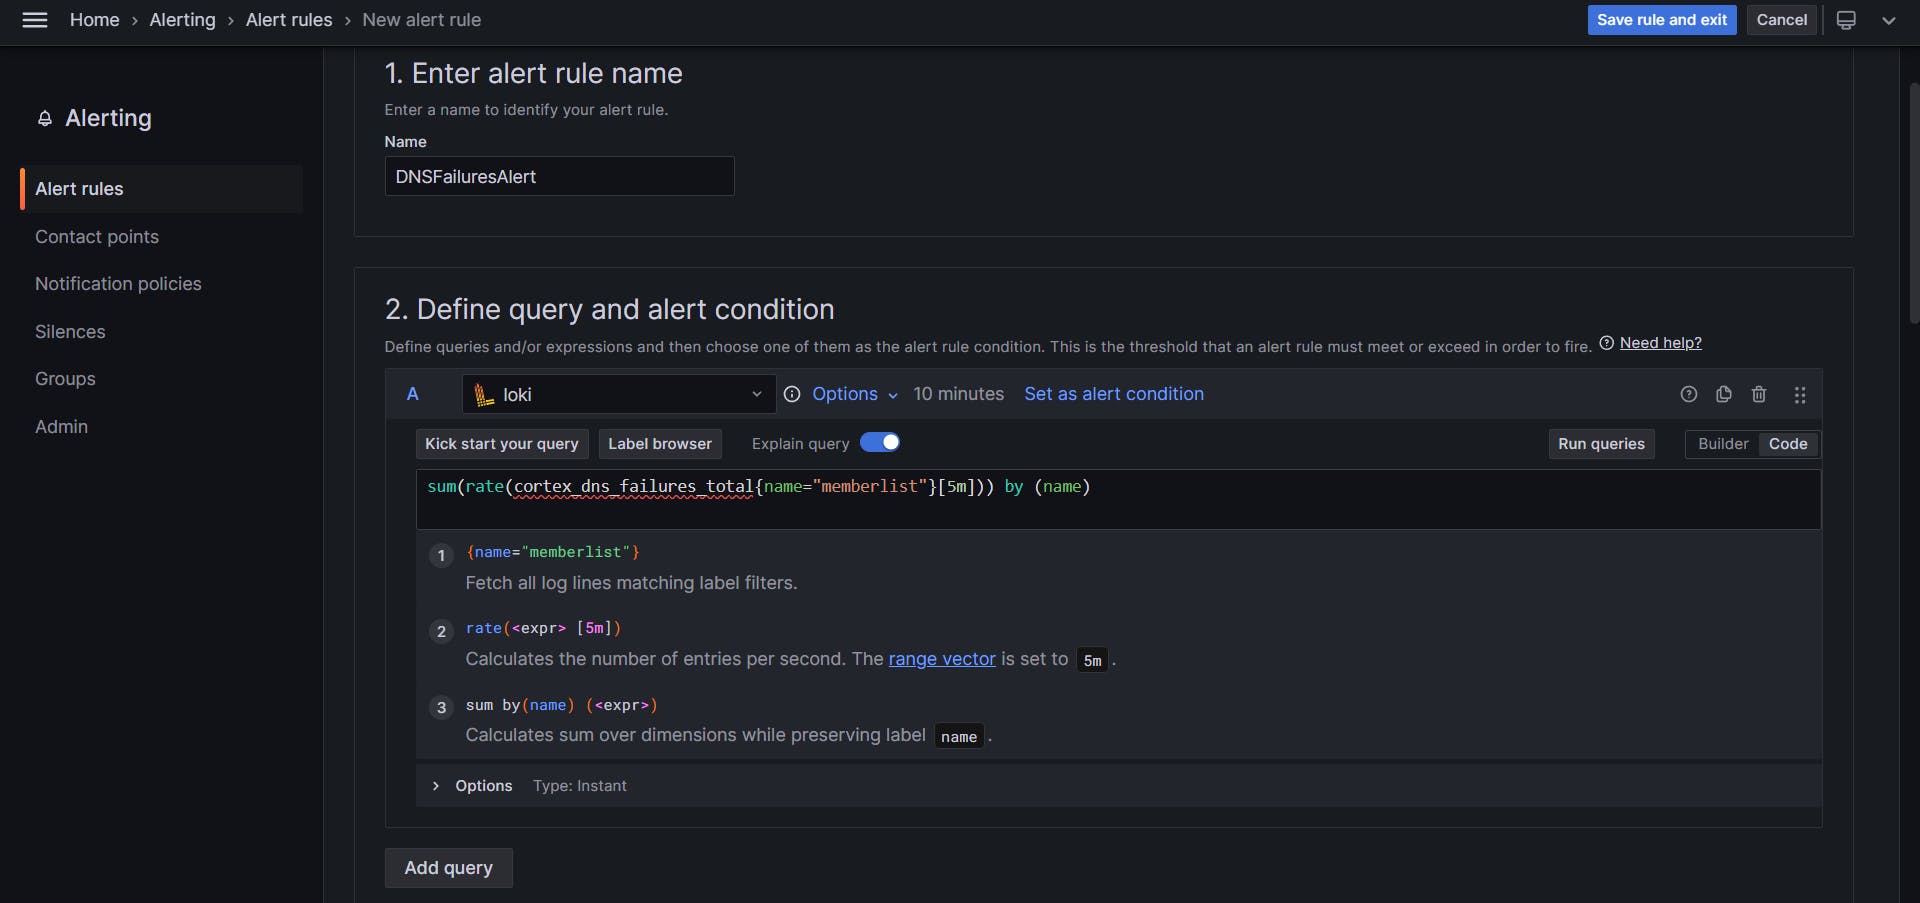
Set a threshold value that, when exceeded, will trigger the alert.
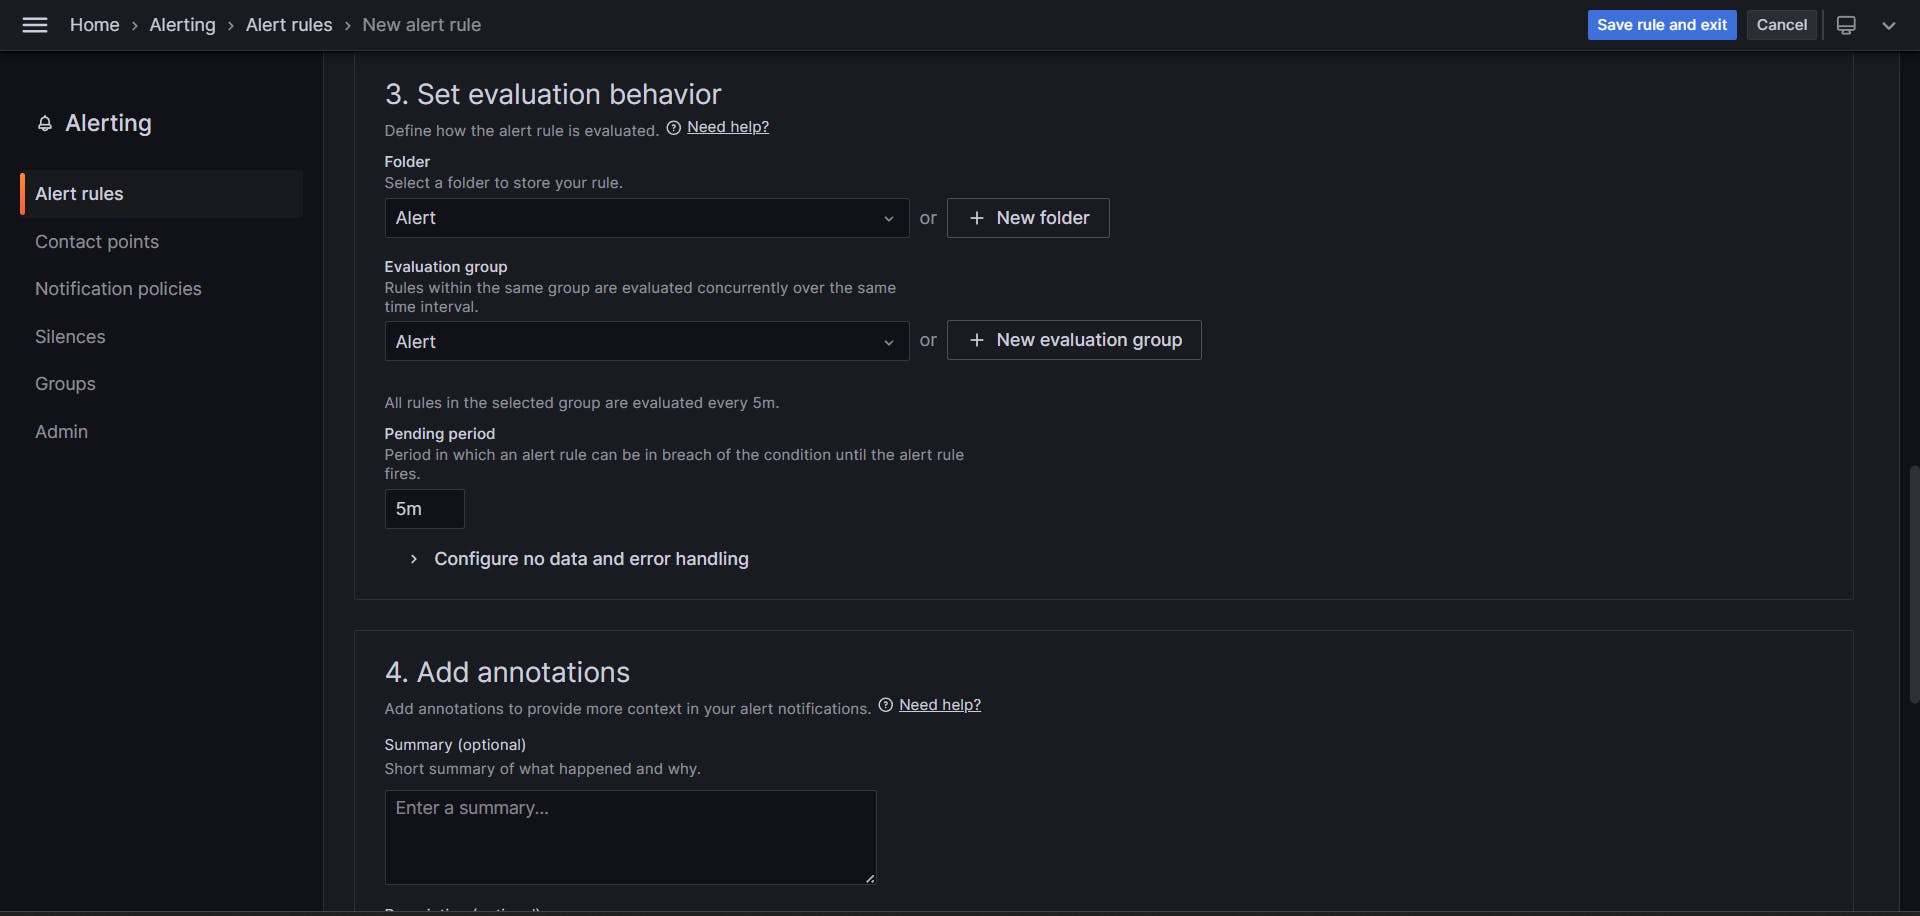
Configure Additional Settings
Adjust the evaluation interval, which determines how frequently Grafana evaluates the alert conditions. Also, specify the duration for which the condition needs to persist for the alert to be triggered.
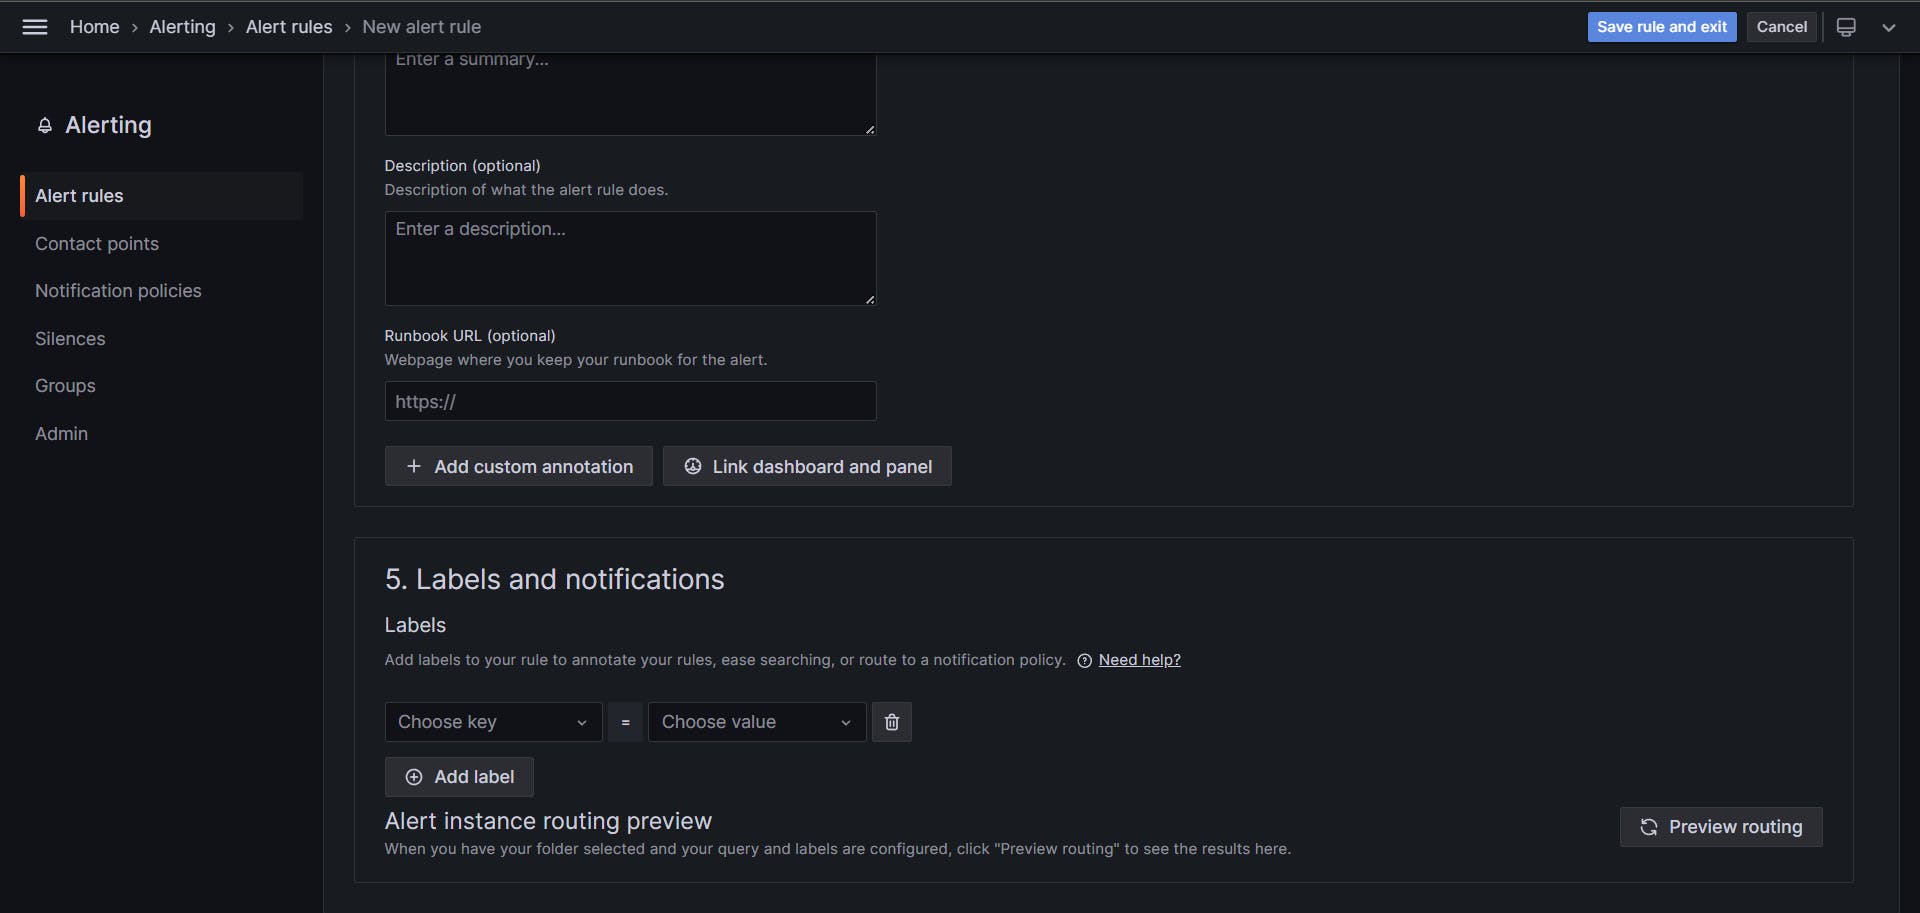
Set Up Annotations and Notification Channels
You can add relevant annotations to provide context to the alert. Configure notification channels, such as email or Slack, where you want to receive alerts.
Preview and Save
Preview the alert to ensure it aligns with your monitoring requirements. Once satisfied, click "Save" to save the alert configuration.
Trigger the Alert for Testing
Testing involves deliberately creating a scenario that triggers the alert condition. For instance, intentionally misconfigure DNS to simulate failures.
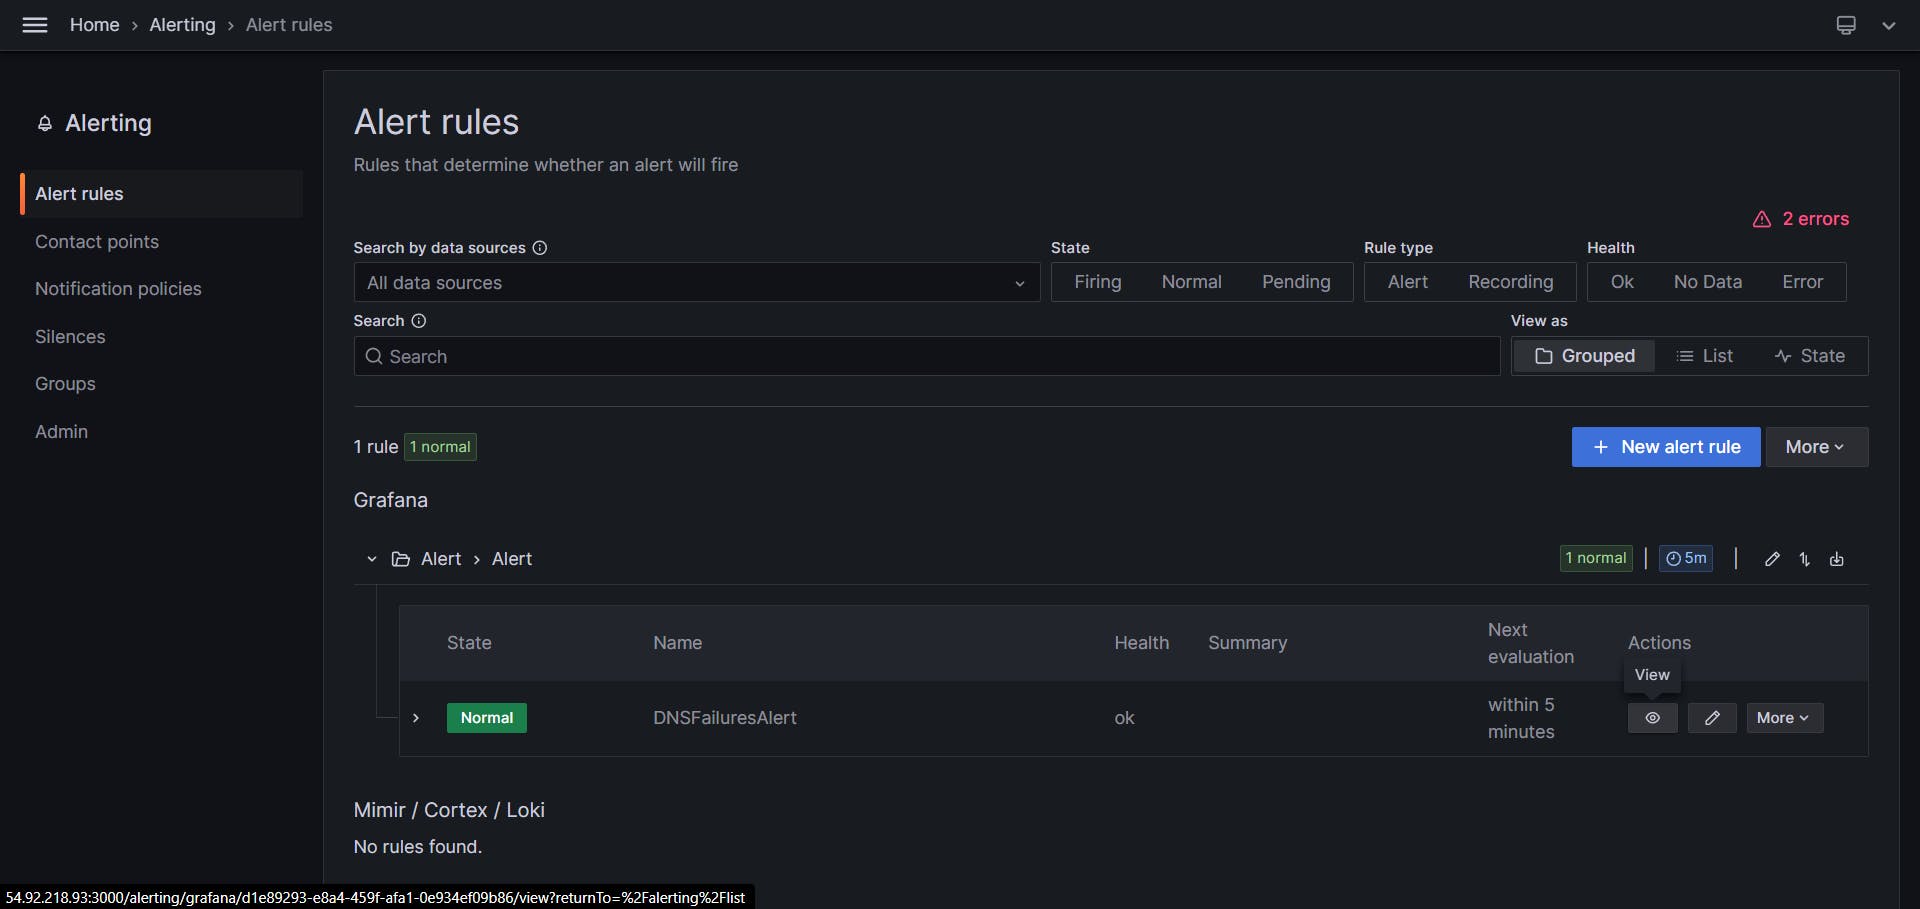
Monitor and Review
Wait for the evaluation interval to pass and monitor the "Alerting" section for the status of your DNS Failures alert. Check the configured notification channels to verify that alerts are being sent.
By following these steps, you can create and test alerts in Grafana, ensuring that your monitoring system is robust and responsive to critical events in your infrastructure.
Thanks for reading until here. Stay tuned, in the next blog we will set up real time alerts for our EC2 instance and AWS billing alert.